mirror of
https://github.com/TwiN/gatus.git
synced 2024-10-05 01:32:25 +02:00
| .. | ||
| config | ||
| grafana | ||
| prometheus | ||
| docker-compose.yml | ||
| README.md | ||
Usage
Gatus exposes Prometheus metrics at /metrics if the metrics configuration option is set to true.
To run this example, all you need to do is execute the following command:
docker-compose up
Once you've done the above, you should be able to access the Grafana dashboard at http://localhost:3000.
Queries
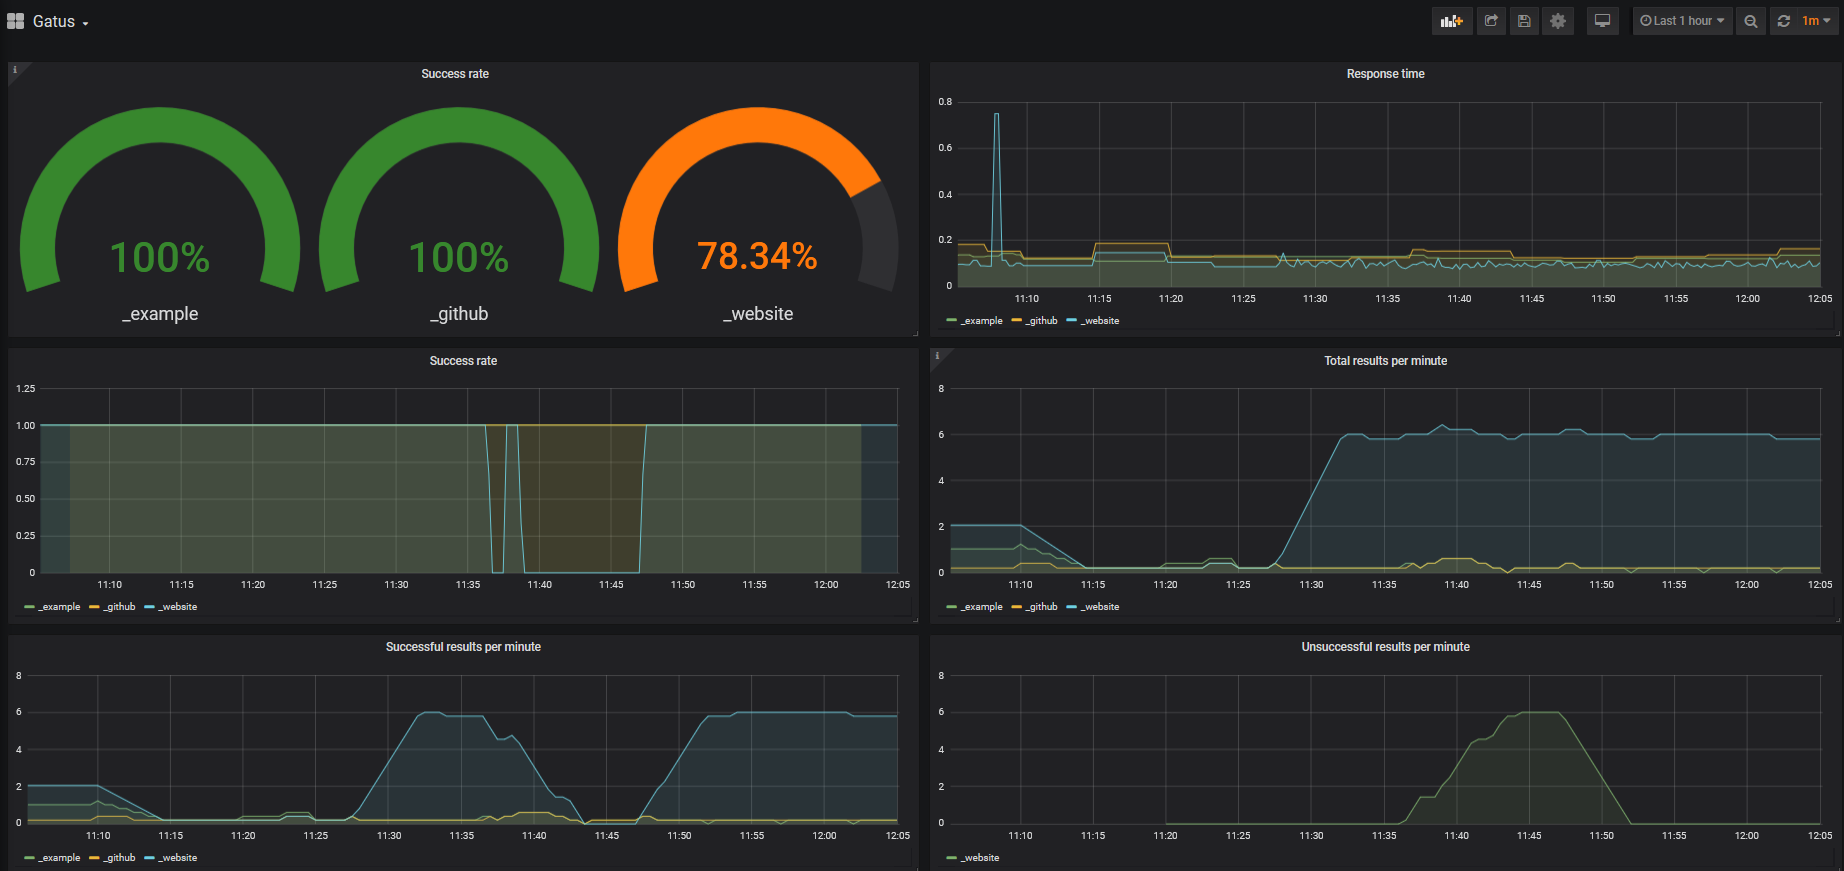
By default, this example has a Grafana dashboard with some panels, but for the sake of verbosity, you'll find
a list of simple queries below. Those make use of the key parameter, which is a concatenation of the endpoint's
group and name.
Success rate
sum(rate(gatus_results_total{success="true"}[30s])) by (key) / sum(rate(gatus_results_total[30s])) by (key)
Response time
gatus_results_duration_seconds
Total results per minute
sum(rate(gatus_results_total[5m])*60) by (key)
Total successful results per minute
sum(rate(gatus_results_total{success="true"}[5m])*60) by (key)
Total unsuccessful results per minute
sum(rate(gatus_results_total{success="false"}[5m])*60) by (key)