![]()
![]()


A service health dashboard in Go that is meant to be used as a docker image with a custom configuration file.
I personally deploy it in my Kubernetes cluster and let it monitor the status of my core applications: https://status.twinnation.org/
Table of Contents
Features
The main features of Gatus are:
- Highly flexible health check conditions: While checking the response status may be enough for some use cases, Gatus goes much further and allows you to add conditions on the response time, the response body and even the IP address.
- Ability to use Gatus for user acceptance tests: Thanks to the point above, you can leverage this application to create automated user acceptance tests.
- Very easy to configure: Not only is the configuration designed to be as readable as possible, it's also extremely easy to add a new service or a new endpoint to monitor.
- Alerting: While having a pretty visual dashboard is useful to keep track of the state of your application(s), you probably don't want to stare at it all day. Thus, notifications via Slack, PagerDuty and Twilio are supported out of the box with the ability to configure a custom alerting provider for any needs you might have, whether it be a different provider or a custom application that manages automated rollbacks.
- Metrics
- Low resource consumption: As with most Go applications, the resource footprint that this application requires is negligibly small.
Usage
By default, the configuration file is expected to be at config/config.yaml.
You can specify a custom path by setting the GATUS_CONFIG_FILE environment variable.
Here's a simple example:
metrics: true         # Whether to expose metrics at /metrics
services:
  - name: twinnation  # Name of your service, can be anything
    url: "https://twinnation.org/health"
    interval: 30s     # Duration to wait between every status check (default: 60s)
    conditions:
      - "[STATUS] == 200"         # Status must be 200
      - "[BODY].status == UP"     # The json path "$.status" must be equal to UP
      - "[RESPONSE_TIME] < 300"   # Response time must be under 300ms
  - name: example
    url: "https://example.org/"
    interval: 30s
    conditions:
      - "[STATUS] == 200"
This example would look like this:
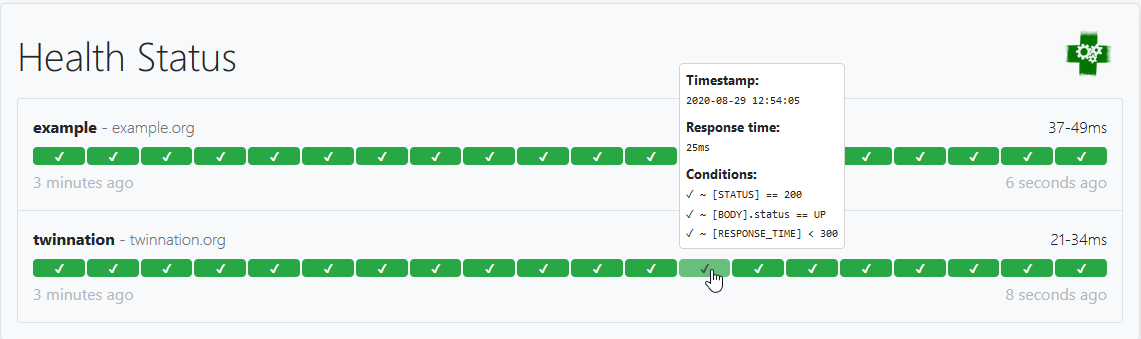
Note that you can also add environment variables in the configuration file (i.e. $DOMAIN, ${DOMAIN})
Configuration
| Parameter | Description | Default |
|---|---|---|
debug |
Whether to enable debug logs | false |
metrics |
Whether to expose metrics at /metrics | false |
services |
List of services to monitor | Required [] |
services[].name |
Name of the service. Can be anything. | Required "" |
services[].url |
URL to send the request to | Required "" |
services[].conditions |
Conditions used to determine the health of the service | [] |
services[].insecure |
Whether to skip verifying the server's certificate chain and host name | false |
services[].interval |
Duration to wait between every status check | 60s |
services[].method |
Request method | GET |
services[].graphql |
Whether to wrap the body in a query param ({"query":"$body"}) |
false |
services[].body |
Request body | "" |
services[].headers |
Request headers | {} |
services[].alerts[].type |
Type of alert. Valid types: slack, pagerduty, twilio, custom |
Required "" |
services[].alerts[].enabled |
Whether to enable the alert | false |
services[].alerts[].failure-threshold |
Number of failures in a row needed before triggering the alert | 3 |
services[].alerts[].success-threshold |
Number of successes in a row before an ongoing incident is marked as resolved | 2 |
services[].alerts[].send-on-resolved |
Whether to send a notification once a triggered alert is marked as resolved | false |
services[].alerts[].description |
Description of the alert. Will be included in the alert sent | "" |
alerting |
Configuration for alerting | {} |
alerting.slack |
Configuration for alerts of type slack |
{} |
alerting.slack.webhook-url |
Slack Webhook URL | Required "" |
alerting.pagerduty |
Configuration for alerts of type pagerduty |
{} |
alerting.pagerduty.integration-key |
PagerDuty Events API v2 integration key. | Required "" |
alerting.twilio |
Settings for alerts of type twilio |
{} |
alerting.twilio.sid |
Twilio account SID | Required "" |
alerting.twilio.token |
Twilio auth token | Required "" |
alerting.twilio.from |
Number to send Twilio alerts from | Required "" |
alerting.twilio.to |
Number to send twilio alerts to | Required "" |
alerting.custom |
Configuration for custom actions on failure or alerts | {} |
alerting.custom.url |
Custom alerting request url | Required "" |
alerting.custom.body |
Custom alerting request body. | "" |
alerting.custom.headers |
Custom alerting request headers | {} |
security |
Security configuration | {} |
security.basic |
Basic authentication security configuration | {} |
security.basic.username |
Username for Basic authentication | Required "" |
security.basic.password-sha512 |
Password's SHA512 hash for Basic authentication | Required "" |
Conditions
Here are some examples of conditions you can use:
| Condition | Description | Passing values | Failing values |
|---|---|---|---|
[STATUS] == 200 |
Status must be equal to 200 | 200 | 201, 404, ... |
[STATUS] < 300 |
Status must lower than 300 | 200, 201, 299 | 301, 302, ... |
[STATUS] <= 299 |
Status must be less than or equal to 299 | 200, 201, 299 | 301, 302, ... |
[STATUS] > 400 |
Status must be greater than 400 | 401, 402, 403, 404 | 400, 200, ... |
[CONNECTED] == true |
Connection to host must've been successful | true, false | |
[RESPONSE_TIME] < 500 |
Response time must be below 500ms | 100ms, 200ms, 300ms | 500ms, 501ms |
[IP] == 127.0.0.1 |
Target IP must be 127.0.0.1 | 127.0.0.1 | 0.0.0.0 |
[BODY] == 1 |
The body must be equal to 1 | 1 | {}, 2, ... |
[BODY].user.name == john |
JSONPath value of $.user.name is equal to john |
{"user":{"name":"john"}} |
|
[BODY].data[0].id == 1 |
JSONPath value of $.data[0].id is equal to 1 |
{"data":[{"id":1}]} |
|
[BODY].age == [BODY].id |
JSONPath value of $.age is equal JSONPath $.id |
{"age":1,"id":1} |
|
len([BODY].data) < 5 |
Array at JSONPath $.data has less than 5 elements |
{"data":[{"id":1}]} |
|
len([BODY].name) == 8 |
String at JSONPath $.name has a length of 8 |
{"name":"john.doe"} |
{"name":"bob"} |
[BODY].name == pat(john*) |
String at JSONPath $.name matches pattern john* |
{"name":"john.doe"} |
{"name":"bob"} |
Placeholders
| Placeholder | Description | Example of resolved value |
|---|---|---|
[STATUS] |
Resolves into the HTTP status of the request | 404 |
[RESPONSE_TIME] |
Resolves into the response time the request took, in ms | 10 |
[IP] |
Resolves into the IP of the target host | 192.168.0.232 |
[BODY] |
Resolves into the response body. Supports JSONPath. | {"name":"john.doe"} |
[CONNECTED] |
Resolves into whether a connection could be established | true |
Functions
| Function | Description | Example |
|---|---|---|
len |
Returns the length of the object/slice. Works only with the [BODY] placeholder. |
len([BODY].username) > 8 |
pat |
Specifies that the string passed as parameter should be evaluated as a pattern. Works only with == and !=. |
[IP] == pat(192.168.*) |
NOTE: Use pat only when you need to. [STATUS] == pat(2*) is a lot more expensive than [STATUS] < 300.
Alerting
Configuring Slack alerts
alerting:
  slack:
    webhook-url: "https://hooks.slack.com/services/**********/**********/**********"
services:
  - name: twinnation
    url: "https://twinnation.org/health"
    interval: 30s
    alerts:
      - type: slack
        enabled: true
        description: "healthcheck failed 3 times in a row"
        send-on-resolved: true
      - type: slack
        enabled: true
        failure-threshold: 5
        description: "healthcheck failed 5 times in a row"
        send-on-resolved: true
    conditions:
      - "[STATUS] == 200"
      - "[BODY].status == UP"
      - "[RESPONSE_TIME] < 300"
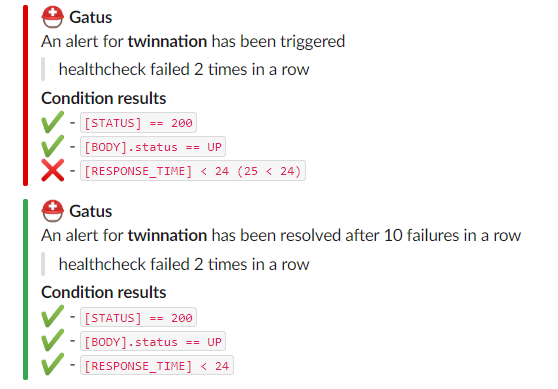
Here's an example of what the notifications look like:
Configuring PagerDuty alerts
It is highly recommended to set services[].alerts[].send-on-resolved to true for alerts
of type pagerduty, because unlike other alerts, the operation resulting from setting said
parameter to true will not create another incident, but mark the incident as resolved on
PagerDuty instead.
alerting:
  pagerduty:
    integration-key: "********************************"
services:
  - name: twinnation
    url: "https://twinnation.org/health"
    interval: 30s
    alerts:
      - type: pagerduty
        enabled: true
        failure-threshold: 3
        success-threshold: 5
        send-on-resolved: true
        description: "healthcheck failed 3 times in a row"
    conditions:
      - "[STATUS] == 200"
      - "[BODY].status == UP"
      - "[RESPONSE_TIME] < 300"
Configuring Twilio alerts
alerting:
  twilio:
    sid: "..."
    token: "..."
    from: "+1-234-567-8901"
    to: "+1-234-567-8901"
services:
  - name: twinnation
    interval: 30s
    url: "https://twinnation.org/health"
    alerts:
      - type: twilio
        enabled: true
        failure-threshold: 5
        send-on-resolved: true
        description: "healthcheck failed 5 times in a row"
    conditions:
      - "[STATUS] == 200"
      - "[BODY].status == UP"
      - "[RESPONSE_TIME] < 300"
Configuring custom alerts
While they're called alerts, you can use this feature to call anything.
For instance, you could automate rollbacks by having an application that keeps tracks of new deployments, and by leveraging Gatus, you could have Gatus call that application endpoint when a service starts failing. Your application would then check if the service that started failing was recently deployed, and if it was, then automatically roll it back.
The values [ALERT_DESCRIPTION] and [SERVICE_NAME] are automatically substituted for the alert description and the
service name respectively in the body (alerting.custom.body) as well as the url (alerting.custom.url).
If you have send-on-resolved set to true, you may want to use [ALERT_TRIGGERED_OR_RESOLVED] to differentiate
the notifications. It will be replaced for either TRIGGERED or RESOLVED, based on the situation.
For all intents and purpose, we'll configure the custom alert with a Slack webhook, but you can call anything you want.
alerting:
  custom:
    url: "https://hooks.slack.com/services/**********/**********/**********"
    method: "POST"
    body: |
      {
        "text": "[ALERT_TRIGGERED_OR_RESOLVED]: [SERVICE_NAME] - [ALERT_DESCRIPTION]"
      }
services:
  - name: twinnation
    url: "https://twinnation.org/health"
    interval: 30s
    alerts:
      - type: custom
        enabled: true
        failure-threshold: 10
        success-threshold: 3
        send-on-resolved: true
        description: "healthcheck failed 10 times in a row"
    conditions:
      - "[STATUS] == 200"
      - "[BODY].status == UP"
      - "[RESPONSE_TIME] < 300"
Docker
Other than using one of the examples provided in the examples folder, you can also try it out locally by
creating a configuration file - we'll call it config.yaml for this example - and running the following
command:
docker run -p 8080:8080 --mount type=bind,source="$(pwd)"/config.yaml,target=/config/config.yaml --name gatus twinproduction/gatus
If you're on Windows, replace "$(pwd)" by the absolute path to your current directory, e.g.:
docker run -p 8080:8080 --mount type=bind,source=C:/Users/Chris/Desktop/config.yaml,target=/config/config.yaml --name gatus twinproduction/gatus
Running the tests
go test ./... -mod vendor
Using in Production
See the example folder.
FAQ
Sending a GraphQL request
By setting services[].graphql to true, the body will automatically be wrapped by the standard GraphQL query parameter.
For instance, the following configuration:
services:
  - name: filter users by gender
    url: http://localhost:8080/playground
    method: POST
    graphql: true
    body: |
      {
        user(gender: "female") {
          id
          name
          gender
          avatar
        }
      }
    headers:
      Content-Type: application/json
    conditions:
      - "[STATUS] == 200"
      - "[BODY].data.user[0].gender == female"
will send a POST request to http://localhost:8080/playground with the following body:
{"query":" {\n user(gender: \"female\") {\n id\n name\n gender\n avatar\n }\n }"}
Recommended interval
To ensure that Gatus provides reliable and accurate results (i.e. response time), Gatus only evaluates one service at a time. In other words, even if you have multiple services with the exact same interval, they will not execute at the same time.
You can test this yourself by running Gatus with several services configured with a very short, unrealistic interval, such as 1ms. You'll notice that the response time does not fluctuate - that is because while services are evaluated on different goroutines, there's a global lock that prevents multiple services from running at the same time.
Unfortunately, there is a drawback. If you have a lot of services, including some that are very slow or prone to time out (the default time out is 10s for HTTP and 5s for TCP), then it means that for the entire duration of the request, no other services can be evaluated.
This does mean that Gatus will be unable to evaluate the health of other services. The interval does not include the duration of the request itself, which means that if a service has an interval of 30s and the request takes 2s to complete, the timestamp between two evaluations will be 32s, not 30s.
While this does not prevent Gatus' from performing health checks on all other services, it may cause Gatus to be unable to respect the configured interval, for instance:
- Service A has an interval of 5s, and times out after 10s to complete
- Service B has an interval of 5s, and takes 1ms to complete
- Service B will be unable to run every 5s, because service A's health evaluation takes longer than its interval
To sum it up, while Gatus can really handle any interval you throw at it, you're better off having slow requests with higher interval.
As a rule of the thumb, I personally set interval for more complex health checks to 5m (5 minutes) and
simple health checks used for alerting (PagerDuty/Twilio) to 30s.
Default timeouts
| Protocol | Timeout |
|---|---|
| HTTP | 10s |
| TCP | 5s |
Monitoring a TCP service
By prefixing services[].url with tcp:\\, you can monitor TCP services at a very basic level:
  - name: redis
    url: "tcp://127.0.0.1:6379"
    interval: 30s
    conditions:
      - "[CONNECTED] == true"
Placeholders [STATUS] and [BODY] as well as the fields services[].body, services[].insecure,
services[].headers, services[].method and services[].graphql are not supported for TCP services.
NOTE: [CONNECTED] == true does not guarantee that the service itself is healthy - it only guarantees that there's
something at the given address listening to the given port, and that a connection to that address was successfully
established.
Basic authentication
You can require Basic authentication by leveraging the security.basic configuration:
security:
  basic:
    username: "john.doe"
    password-sha512: "6b97ed68d14eb3f1aa959ce5d49c7dc612e1eb1dafd73b1e705847483fd6a6c809f2ceb4e8df6ff9984c6298ff0285cace6614bf8daa9f0070101b6c89899e22"
The example above will require that you authenticate with the username john.doe as well as the password hunter2.