2.8 KiB
Visualizing System Relationships
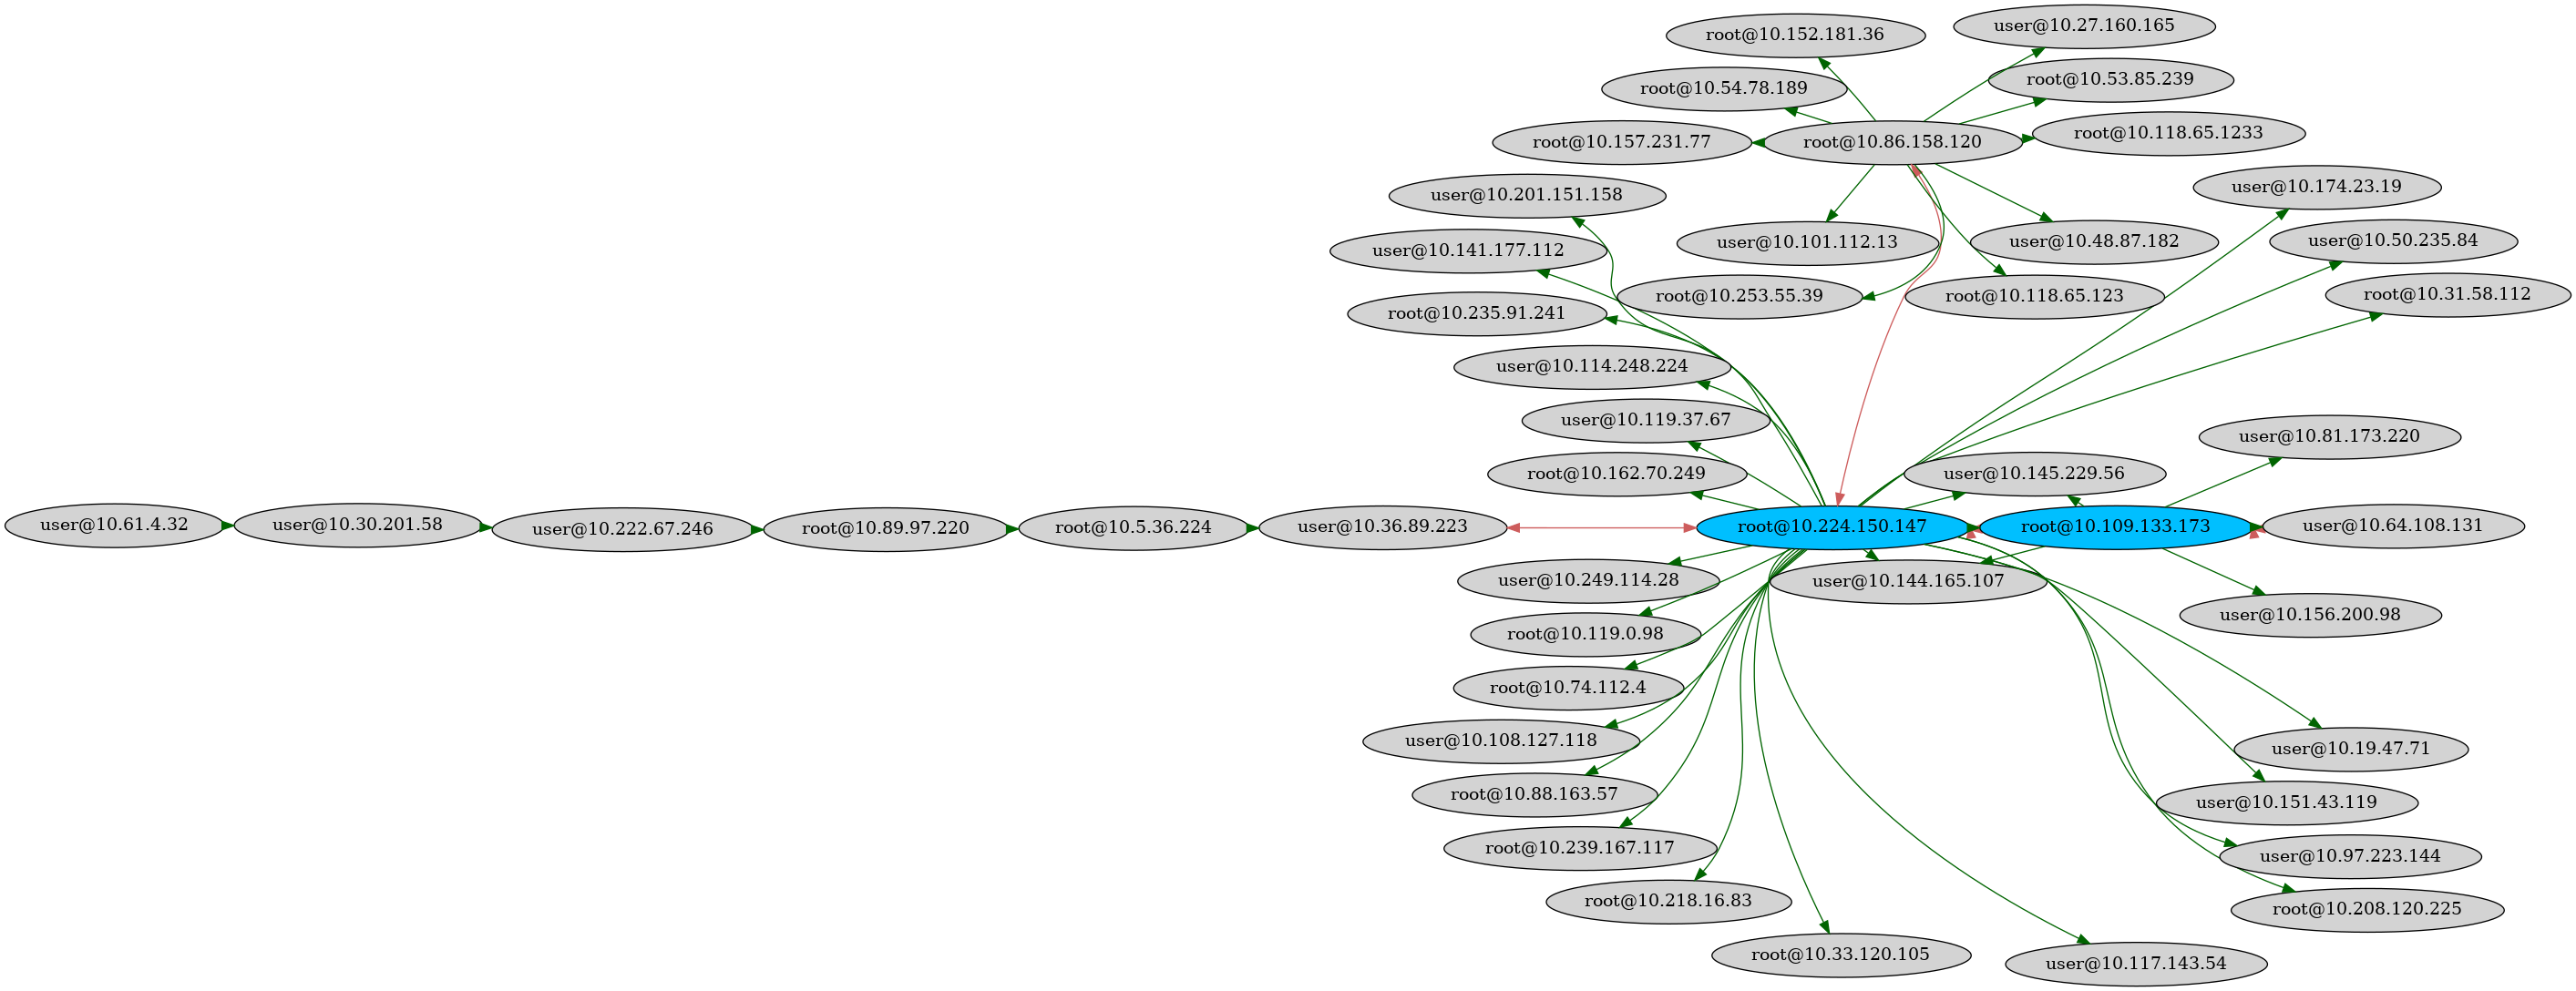
SSH-Snake's output can be used to create visualizations of the network it has traversed. For example, using the python script generate-graph.py provided in tools/, we can generate a PNG visualizing the network:
 In this image, the blue nodes indicate a destination that can connect to itself (meaning a key on the system is also trusted by
 authorized_keys). The red edges/lines indicate that the connection from one system to another is bi-directional, meaning system A can SSH to system B and system B can SSH to system A. Note that this image includes usernames in the system labels.
This graph was created using the command:
python3 tools/generate-graph.py --with-users --file SSHSnake.log --format dot
circo -Tpng -Goverlap=false -Gsplines=true -Gconcentrate=true -Gnodesep=0.1 -Goverlap=false SSHSnake_dot_file.dot -o SSH-Snake-dot-circo.png
which first generates a [dot file](https://en.wikipedia.org/wiki/DOT_(graph_description_language), then uses graphviz' circo to generate a PNG.
An alternative visualization can be created in gexf format, and then Gephi can be used to create another meaningful image:
In this image, the green nodes indicate a host (without a username) that can connect to itself, and green lines/edges indicate that the connection is bi-directional. The gray host in the top right corner is the host that the script was initially executed on. Note that the hosts do not include the usernames of the system, and this visualization indicates system to system connections, rather than destination (user@host) to destination (user@host) connections.
This graph was created using the command (note the lack of --with-users):
python3 tools/generate-graph.py --file SSHSnake.log --format gexf
Using Gephi, the final image was generated.
Cytoscape is another tool that can be used to generate interesting graphs. Using the same gexf format output file from before, you can install the gexf-app app for Cytoscape and import the file.
|
Not only can you create an image like this in Cytoscape (using the "yFiles hierarchical Layout"), you can also create webpages like this one: https://megamansec.github.io/SSH-Snake/.
