2.4 KiB
Configuring Metrics
A fully configured, production-scale zrok service instance looks like this:
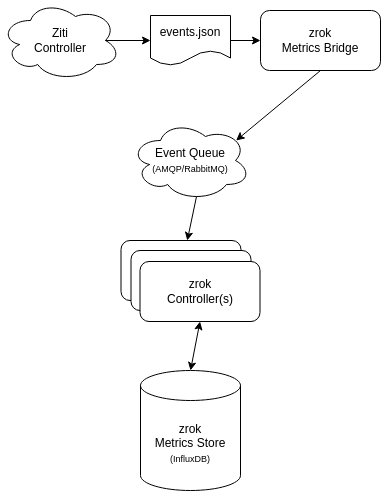
zrok metrics builds on top of the fabric.usage event type from OpenZiti. The OpenZiti controller has a number of way to emit events. The zrok controller has several ways to consume fabric.usage events. Smaller installations could be configured in these ways:
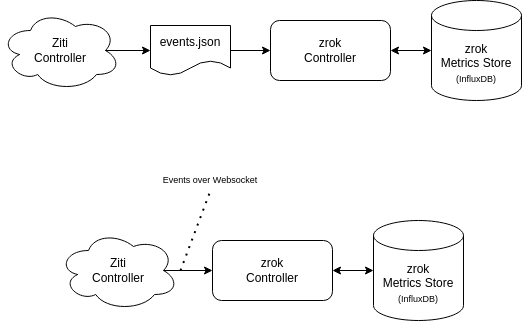
Environments that horizontally scale the zrok control plane with multiple controllers should use an AMQP-based queue to "fan out" the metrics workload across the entire control plane. Simpler installations that use a single zrok controller can collect fabric.usage events from the OpenZiti controller by "tailing" the events log file, or collecting them from the OpenZiti controller's websocket implementation.
Configuring the OpenZiti Controller
Emitting fabric.usage events to a file is currently the most reliable mechanism to capture usage events into zrok. We're going to configure the OpenZiti controller to append fabric.usage events to a file, by adding this stanza to the OpenZiti controller configuration:
events:
  jsonLogger:
    subscriptions:
      - type: fabric.usage
        version: 3
    handler:
      type: file
      format: json
      path: /tmp/fabric-usage.json
You'll want to adjust the events/jsonLogger/handler/path to wherever you would like to send these events for ingestion into zrok. There are additional OpenZiti options that control file rotation. Be sure to consult the OpenZiti docs to tune these settings to be appropriate for your environment.
By default the OpenZiti events infrastructure reports and batches events in 1 minute buckets. 1 minute is too large of an interval to provide a snappy zrok metrics experience. So, let's increase the frequency to every 5 seconds. Add this to the network stanza of your OpenZiti controller:
network:
  intervalAgeThreshold: 5s
  metricsReportInterval: 5s
And you'll want to add this stanza to the router configuration for every router on your OpenZiti network:
metrics:
  reportInterval: 5s
  intervalAgeThreshold: 5s
Be sure to restart all of the components of your OpenZiti network after making these configuration changes.